Quick Tip - Monitoring GPU Memory Usage in Machine Learning Apps
Many machine learning applications require GPUs to run efficiently for training and inference. The thing is - GPUs are expensive and modern ML apps are very, very memory hungry, Large Language Models (LLMs) especially. As an example, I can squeeze a 16bit Falcon-7B instance onto a 16Gb VRAM Nvidia T4 GPU for inference, so VRAM doesn’t go very far - and it’s very difficult to know in advance exactly how much memory you’ll need for a given task.
Now, if you are pushing the envelope, you can go ahead and buy (or rent) a $10k USD Nvidia A100, a $40k USD Nvidia H100 and so on, with 80Gb+ VRAM - but even then, you might find yourself short. So, monitoring memory usage becomes critical. Let’s take a look at some quick and easy ways to monitoring memory usage, with a focus on notebook envionments (like colab).
Remember, we generally want this interactively - since training might take some time and memory might fluctuate over that period, and inference can be quick and spiky in terms of total memory use.
Ways to Monitor
First, how do we baseline our meory usage? The easy thing to do is look at the configuration of your machine - what GPU and device type, and check online for the stats. For a more sophisticated way of doing it, we can:
!nvidia-smi
That’s going to print a table of the devices we have, their memory usage and temperature. e.g. A colab T4 instance gives us:
+-----------------------------------------------------------------------------+
| NVIDIA-SMI 525.85.12    Driver Version: 525.85.12    CUDA Version: 12.0     |
|-------------------------------+----------------------+----------------------+
| GPU  Name        Persistence-M| Bus-Id        Disp.A | Volatile Uncorr. ECC |
| Fan  Temp  Perf  Pwr:Usage/Cap|         Memory-Usage | GPU-Util  Compute M. |
|                               |                      |               MIG M. |
|===============================+======================+======================|
|   0  Tesla T4            Off  | 00000000:00:04.0 Off |                    0 |
| N/A   48C    P0    27W /  70W |  14675MiB / 15360MiB |      0%      Default |
|                               |                      |                  N/A |
+-------------------------------+----------------------+----------------------+
Now that we have a baseline, how can we interactively monitor stats - remembering that a notebook lets us run one cell at a time only (and we assume we cannot run other commands)?
1. Google Colab - Manage Session Overview Screen
For Google Colab, a quick way to get an overview of the current memory usage of a given session is to go into Runtime > Manage Sessions and you’ll see something like:
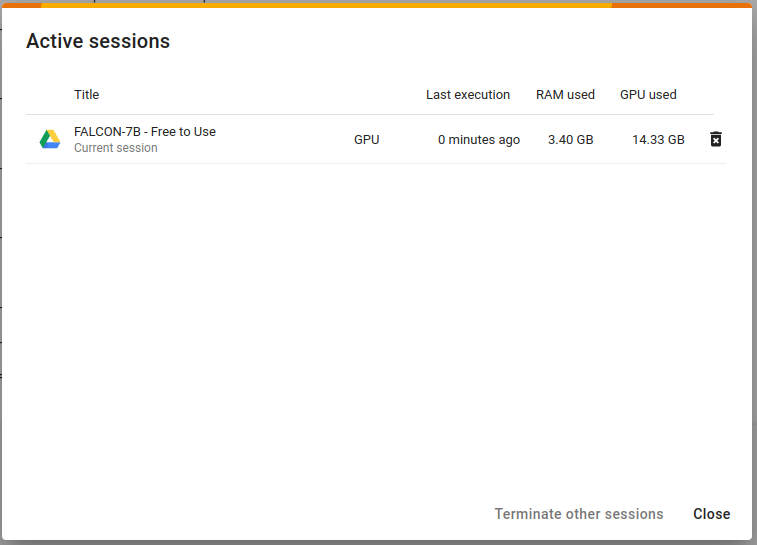
This is telling you how much GPU memory is actually being used (not how much is available) - and likewise, how much RAM. This total seems to update every 10 seconds. Colab Pro might work differently, and other cloud notebook providers might have different UIs for these session statistics. In fact, I think Colab Pro lets us have multiple concurrent sessions - or at least run commands concurrently to our main session. Don’t quote me on that, I am poor.
2. WanDB - UI with Remote Stats
WanDB is a telemetry service for tracking metrics associated with ML experiments. Usually that is things like loss, but here we can use it for GPU memory usage. We do need to sign up for an account and get an apikey (there seems to be a free tier) but once we have that, we can track stats even when we’re down the pub. We just need to run some code:
!pip install wandb
import wandb
wandb.init()
That’s going to prompt for the apikey and then spit out a tracking URL that we can visit on another device (with a login) and see what our ML experiment is doing. Pretty cool, kinda magic, get it?
3. Nvidia SMI Interactive
This command will give us an interactive table. Colab won’t clear the previous output - but you can clear output if you like, manually or via script.
nvidia-smi -l 1
The trick with this is that you’ll want to run it concurrently with your python code, which is tricky. I think you can do this by running watch and python with linux’s & mode - so whack & after it. I didn’t verify this because putting the python code you want to run as a training loop into a python file that you can feed to python.exe feels crappy. However - this is a great solution if you can escape the notebook and have a second session, but don’t have a desktop for a regular UI.
4. Callbacks - eg. HuggingFace Training Callbacks
These are standard ways within huggingface transformers of integrating with progress trackers. You can use these to talk to wandb and many other solutions, and you can additionally customize (write your own) callbacks to print stats to the screen that you care about.
https://huggingface.co/transformers/v3.4.0/main_classes/callback.html
That’s it folks
Let me know if you have any questions.